Free AI Line Graph Generator
Connect the dots without touching a spreadsheet.
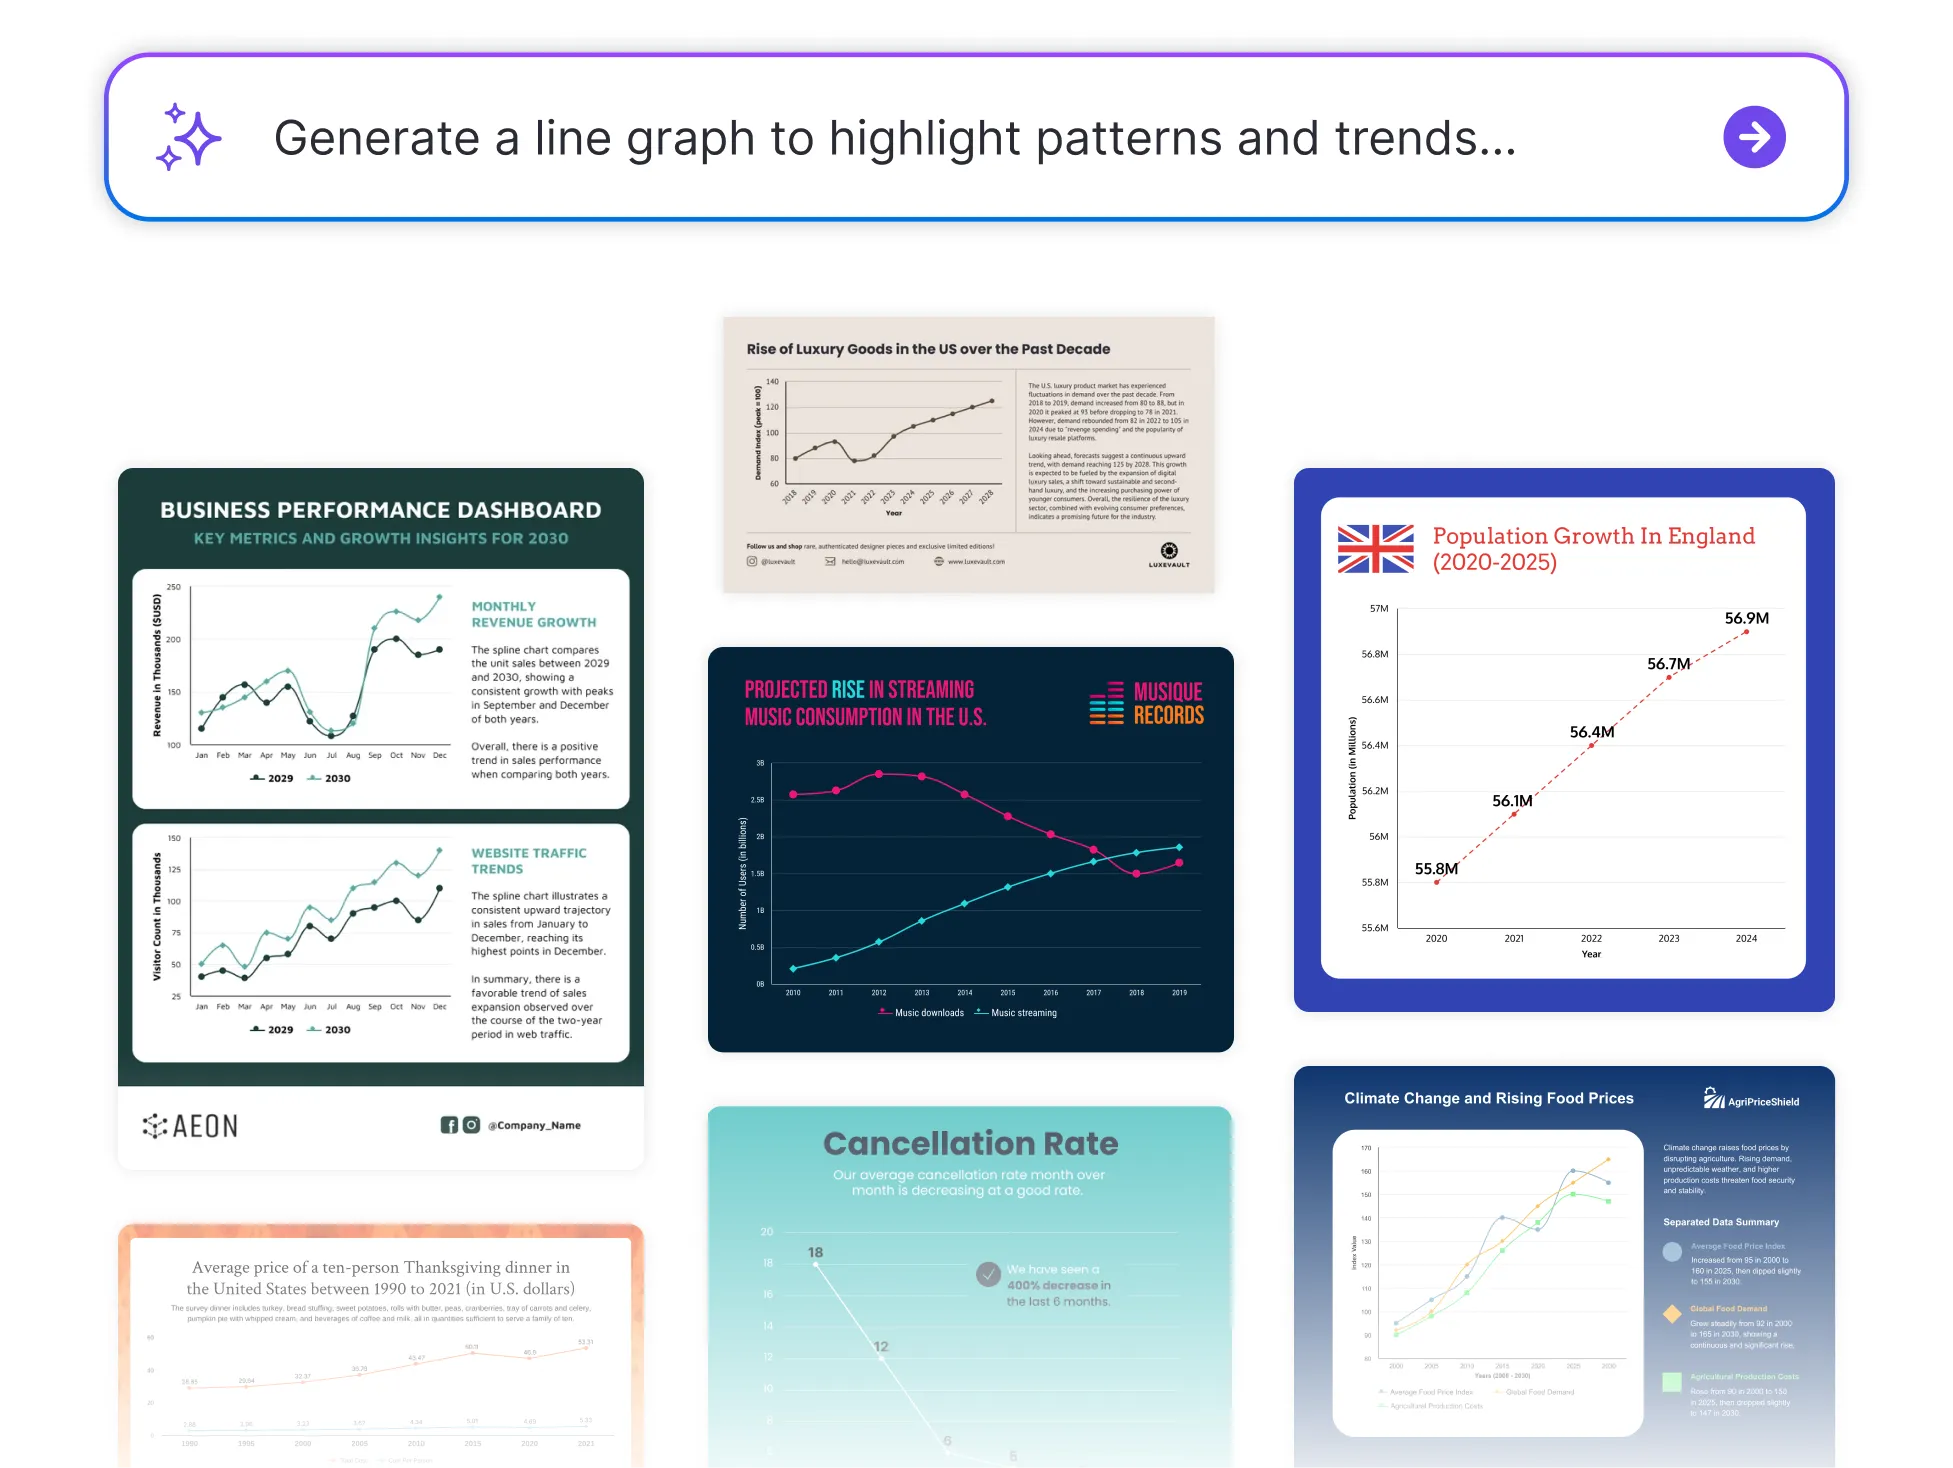
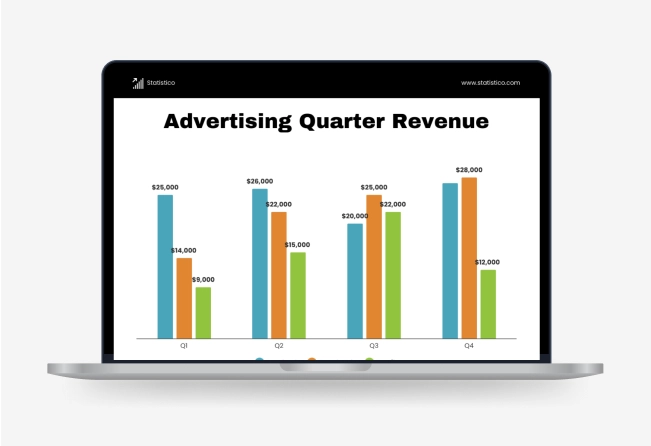
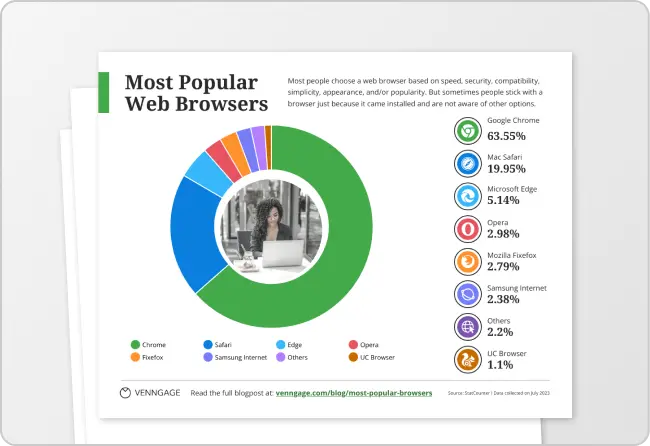
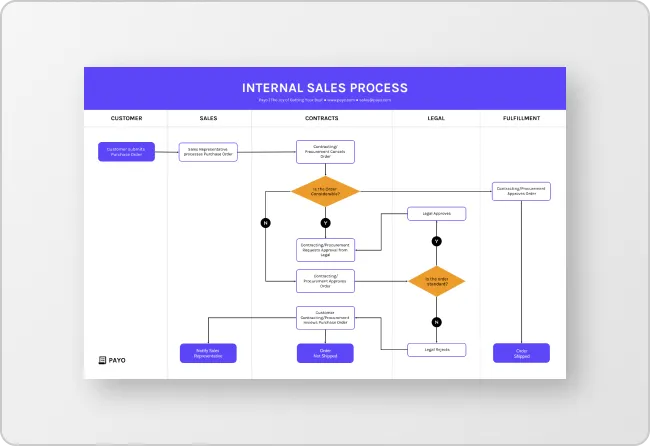
Browse Through More Line Graph Templates
Popular AI Design Generators

How to Create a Line Graph in Under 5 Minutes
Step 1: Input Your Data
Start by typing or pasting your values, whether you're showing growth over time, comparing trends, or highlighting patterns.
Step 2: Let AI Generate the Graph
Venngage’s AI instantly turns your data into a clean, professional line graph—no need to fiddle with chart settings.
Step 3: Fine-Tune Labels and Axes
Easily edit your axis titles, data labels, and value points to make your graph clear and accurate.
Step 4: Customize the Look
Use Venngage’s drag-and-drop editor to change colors, fonts, or line styles. Apply your Brand Kit for a consistent, polished look.
Step 5: Download or Share Instantly
Export your graph as a PDF, PNG, or shareable link and rop into a report, presentation, or dashboard.
Analysts Looking to Present Trends Clearly
Whether you're reporting KPIs, tracking performance, or forecasting results, line graphs are a go-to for showing change over time. Venngage’s Line Graph Generator helps you turn raw numbers into clean, professional visuals without the usual spreadsheet hassle.
Just input your data and let the generator do the work, so your insights are easy to see and even easier to share.
Generate a Line Graph